1.2 Total product, marginal product, and average product
The total product function
Consider a firm with production function F. Suppose that we vary only one input, holding all other inputs fixed. Specifically, assume that there are n inputs and the amount of every input i for i ≠ j is fixed at ki. Then the amount of output the firm can produce as it varies the amount of input j is given by the function Gj defined by
- Example: fixed proportions
-
Suppose that there are two inputs and the production technology has fixed proportions, so that the production function takes the form
F(z1, z2) = min{az1, bz2},where a and b are positive constants. If z2 is fixed at k, the total product function for input 1 isTP1(z1) = min{az1, bk}or equivalentlyThis function is shown in the following figure.
TP1(z1) = 
az1 if z1 ≤ bk/a bk if z1 > bk/a. 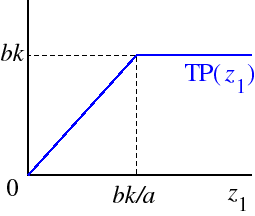
- Example: perfect substitutes
-
If there are two inputs and these inputs are perfect substitutes then the production function takes the form
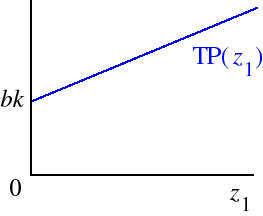
F(z1, z2) = az1 + bz2where a and b are positive constants. If z2 is fixed at k, the total product function for input 1 isTP1(z1) = az1 + bk.This function is shown in the following figure.
- Example: Cobb–Douglas production function
-
If there are two inputs and output is given by a Cobb–Douglas production function then the production function takes the form
F(z1, z2) = Azuwhere A, u, and v are positive constants. If z2 is fixed at k, the total product function for input 1 is
1zv
2,TP1(z1) = AzuFor u = 1/2 this function is shown in the following figure.
1kv.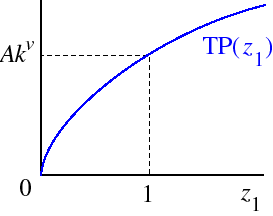
The marginal product and average product functions
A useful concept when thinking about how the output of a firm varies as it changes one input, holding all other inputs fixed, is the rate of increase of the total product, known as the marginal product of the input that can be varied. The marginal product for any value of the variable input is the slope of the total product function at that point. In particular, if the total product function is differentiable, the marginal product is the derivative of the total product function.The average product of input i given the values ki for i ≠ j of the other inputs is defined to be the average output per unit of input i:
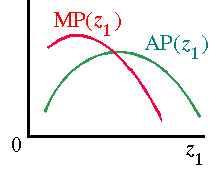
Geometrically, the marginal product for any value of zi is the slope of the total product function at zi; the average product is the slope of a line from the origin to the point (zi, TPi(zi)) on the total product function.
- Example: fixed proportions
-
If there are two inputs, the production technology has fixed proportions, and input 2 is fixed at k, the total product function for input 1 is
so that the marginal product function of input 1 is
TP1(z1) = az1 if z1 ≤ bk/a bk if z1 > bk/a, and the average product function of input 1 isMP1(z1) = a if z1 ≤ bk/a 0 if z1 > bk/a, These functions are illustrated in the following figure.AP1(z1) = a if z1 ≤ bk/a bk/z1 if z1 > bk/a. 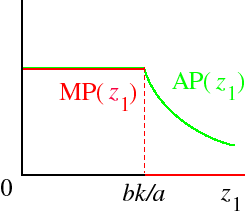
For example, if F(z1, z2) = min{2z1, 4z2} and the amount z2 of input 2 is fixed at 5, we have TP1(z1) = min{2z1, 20}, or
TP1(z1) = 2z1 if z1 ≤ 10 20 if z1 > 10, andMP1(z1) = 2 if z1 ≤ 10 0 if z1 > 10, AP1(z1) = 2 if z1 ≤ 10 20/z1 if z1 > 10.
- Example: perfect substitutes
-
If there are two inputs, the two inputs are perfect substitutes, and input 2 is fixed at k, then the total product function for input 1 is given by
TP1(z1) = az1 + bkso that the marginal product function of input 1 isMP1(z1) = aand the average product function of input 1 isAP1(z1) = a + bk/z1.These functions are illustrated in the following figure.
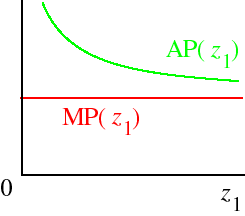
Note that the marginal product is constant, independent of z1: no matter how much of input 1 the firm is using, the extra output it can obtain from one additional unit of the input is the same, equal to a.
- Example: Cobb–Douglas production function
-
If there are two inputs, the technology is described by a Cobb–Douglas production function, and input 2 is fixed at k, then the total product function for input 1 is given by
TP1(z1) = Azuso that the marginal product function of input 1 is
1kvMP1(z1) = Auzu−1and the average product function of input 1 is
1kvAP1(z1) = Azu−1These functions are illustrated in the following figure. The values of both functions increase without bound as z1 converges to 0 because u − 1 < 0.
1kv.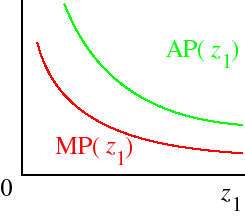
Specifically, if A = 1 and u = v = 1/2, for example,
MP1(z1) = (1/2)z−1/2and
1k1/2 = k1/2/(2z1/2
1)AP1(z1) = z−1/2
1k1/2 = k1/2/z1/2
1.
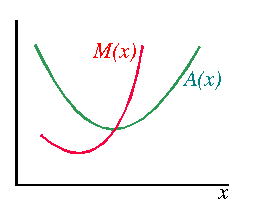
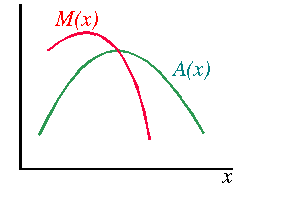
Relation between total, marginal, and average functions in general
Let x be a variable (the amount of an input, the amount of output, ...) and let f(x) be a function of x (total product, total cost, ...). Assume that f is differentiable. The marginal of f is its slope:A useful relationship between the marginal M and the average A is obtained by differentiating A:
- if M(x) > A(x) then A is increasing
- if M(x) = A(x) then A is constant
- if M(x) < A(x) then A is decreasing.
while if A has the shape of an inverted U then we get the picture
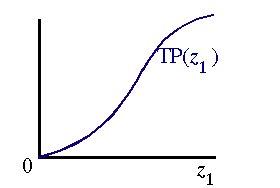
In particular, if the total product function that looks like this
then the average product increases and then decreases, so that the marginal product and average product functions look like this