
8.5 Exercises on differential equations: phase diagrams for autonomous equations
- Draw the phase diagrams associated with the following differential equations and determine the nature of the possible equilibrium states.
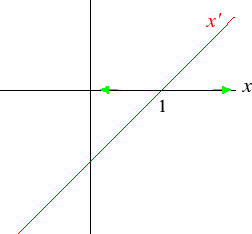
- x'(t) = x(t) − 1.
The phase diagram is shown below. x = 1 is unstable.
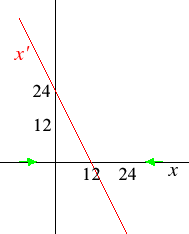
- x'(t) + 2x(t) = 24.
The phase diagram is shown below. x = 12 is stable.
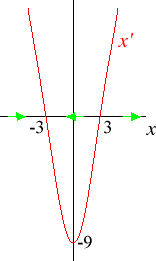
- x'(t) = x(t)2 − 9.
The phase diagram is shown below. x = −3 is stable; x = 3 is unstable.
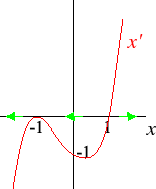
- x'(t) = x(t)3 + x(t)2 − x(t) − 1.
Note that x'(t) = (x(t) − 1)(x(t) + 1)2. x = 1 is unstable; x = −1 is unstable. (It is stable from the right and unstable from the left.) The phase diagram is shown below.
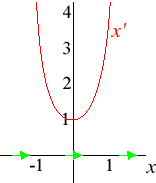
- x'(t) = 3x(t)2 + 1.
The phase diagram is shown below. There are no equilibrium states.
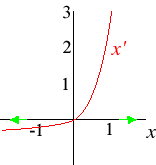
- x'(t) = x(t)ex(t).
The phase diagram is shown below. There is a single equilibrium, x = 0, which is unstable.
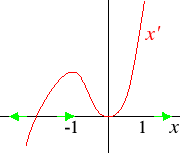
- x'(t) = (x(t) + 2)(x(t))2.
The phase diagram is shown below. There are two equilibria, x = −2 and x = 0. The equilibrium x = −2 is unstable; the equilibrium x = 0 is unstable. (It is stable from the left, but not from the right.)
- x'(t) = x(t) − 1.