1.7 Exercises on graphical representation of functions
- Sketch the following functions of a single variable for the domain −2 ≤ x ≤ 2.
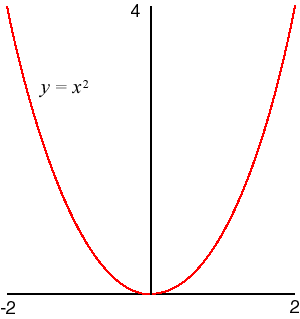
- f(x) = x2
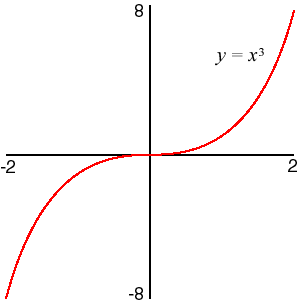
- f(x) = x3
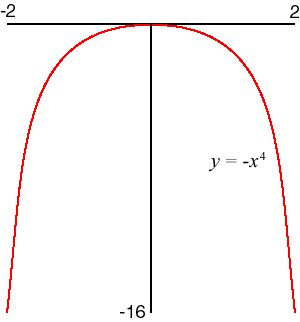
- f(x) = −x4
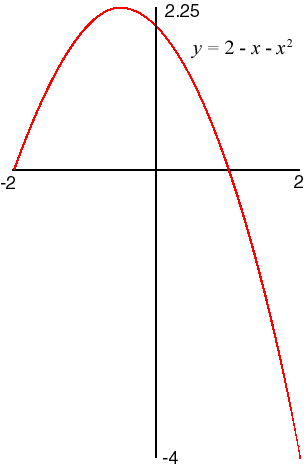
- f(x) = 2 − x − x2
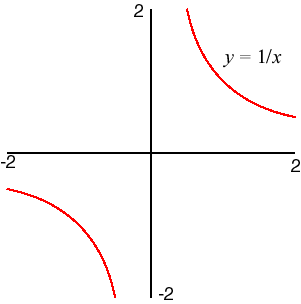
- f(x) = 1/x
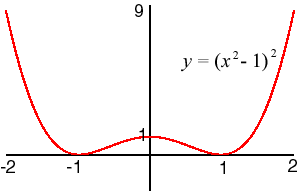
- f(x) = (x2 − 1)2
- The function is nonnegative for all values of x. It is zero at x = −1 and at x = 1, and f(x) = f(−x) for all x, so that its graph is symmetric about a vertical line at x = 0.
- Sketch some level curves of the following functions of two variables.
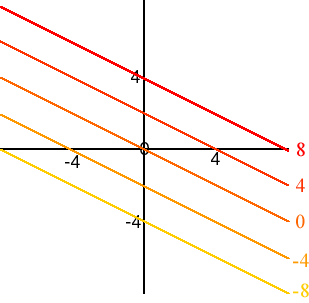
- f(x, y) = x + 2y
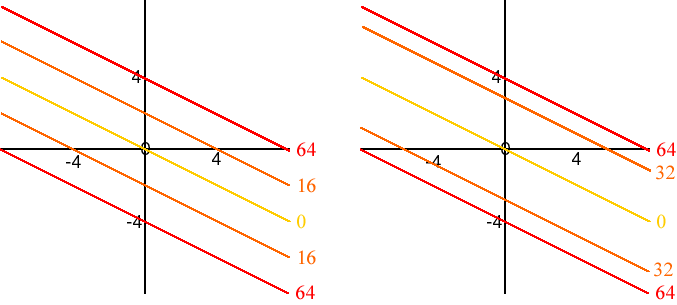
- f(x, y) = (x + 2y)2
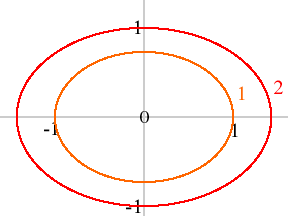
- f(x, y) = x2 + 2y2
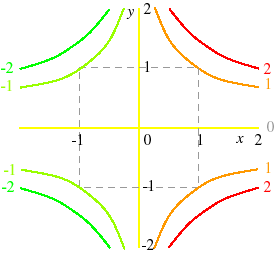
- f(x, y) = xy2
- Note that the level curve for each value except 0 in the following figure consists of the union of two lines. In the figure on the left the level curves for the values 0, 16, and 64 are shown. In the figure on the right the level curves for regularly spaced values are shown.
- Sketch the following sets in the plane.
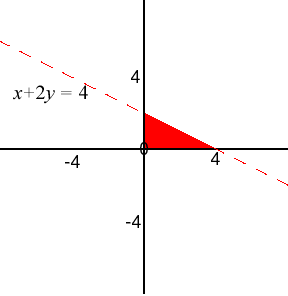
- {(x,y): x + 2y ≤ 4, x ≥ 0, and y ≥ 0}
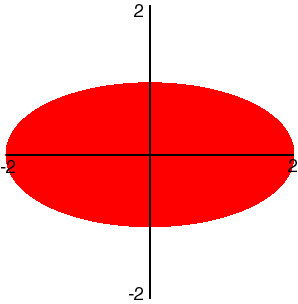
- {(x,y): x2 + 4y2 ≤ 4}
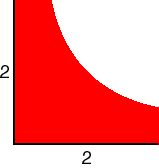
- {(x,y): xy ≤ 4, 0 ≤ x ≤ 4, 0 ≤ y ≤ 4}
